Understanding the steepening yield curve: what it means for the economy
The economy's health is frequently analyzed through indicators that predict future trends. One of the most consistent predictors in the financial world has been the yield curve. In particular, the steepening of the yield curve has long been associated with the onset of economic recessions. But what exactly does this steepening mean, and why has the current steepening not yet ushered in a recession? Let's dive deep into this intriguing topic.
When the yield curve steepens: historical context
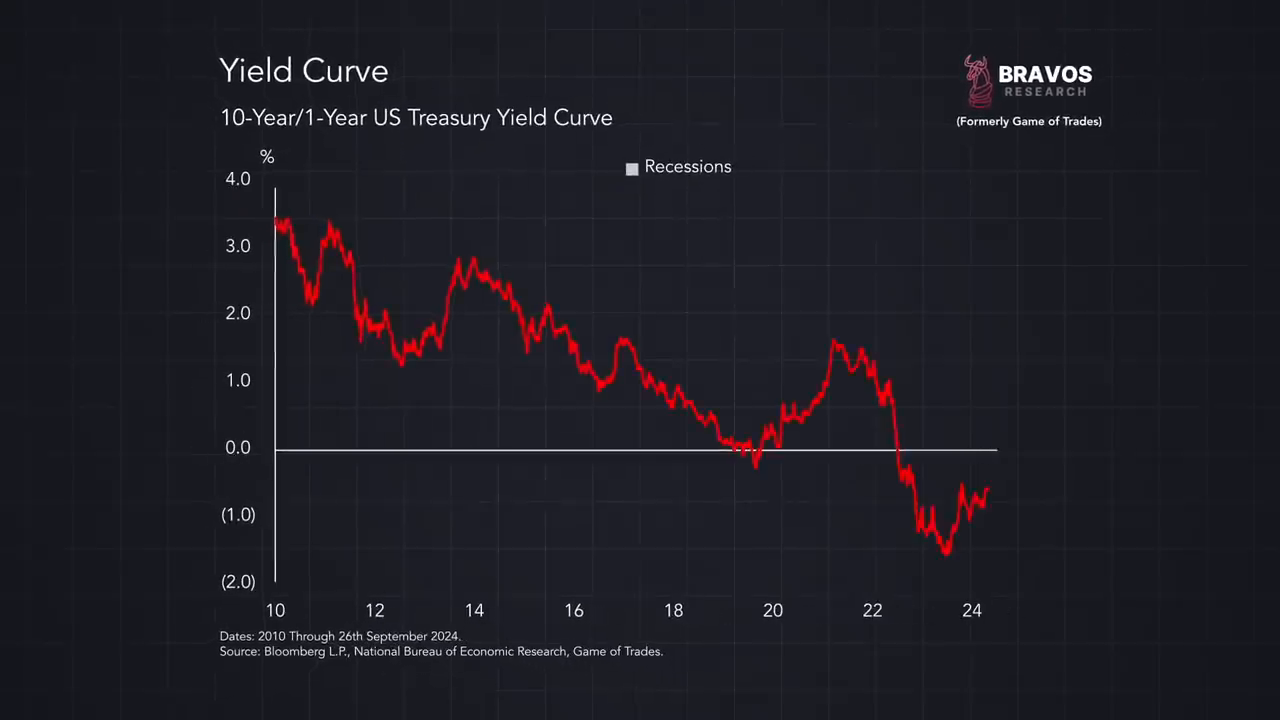
Historical analysis of the yield curve steepening and its implications.
The steepening of the yield curve is not unprecedented. Historically, it has almost always coincided with either the onset of or a recession already in progress. Let's revisit its moments of historical significance:
- 2020 (Covid-19 recession): This event marked a sharp economic downturn due to the global pandemic; the yield curve steepened as the economy braced for its challenges.
- 2007 (Great Financial Crisis): The steepening yield curve was a clear precursor to the significant economic recession that the world endured.
- 2001 (Dot-com bubble burst): As the tech bubble burst, the yield curve again signaled its predictive capability.
- 1929 (The Great Depression): The yield curve steepened in October 1929, precisely when the Great Depression began.
Across all these scenarios, the steepening yield curve has been a harbinger of economic downturns, acting as a reliable early warning system.
What is the yield curve, and why does steepening matter?
To decode the significance of the steepening, it’s essential to understand what the yield curve is and how it operates. The yield curve represents the difference between long-term bond yields (e.g., the 10-year Treasury bond) and short-term yields (e.g., the 2-year Treasury bond). Typically, long-term yields are higher than short-term ones, creating a curve above zero. However, when the reverse occurs, it’s called yield curve inversion.
When the Federal Reserve raises interest rates—referred to as "restrictive policy"—short-term yields often rise above long-term yields, creating an inversion. The steepening usually happens when the Fed begins cutting rates due to an economic slowdown; this reflects the market's anticipation of worsening conditions. Historically, steepening has coincided with declining bank lending and eventual recession.
Where is today's recession?
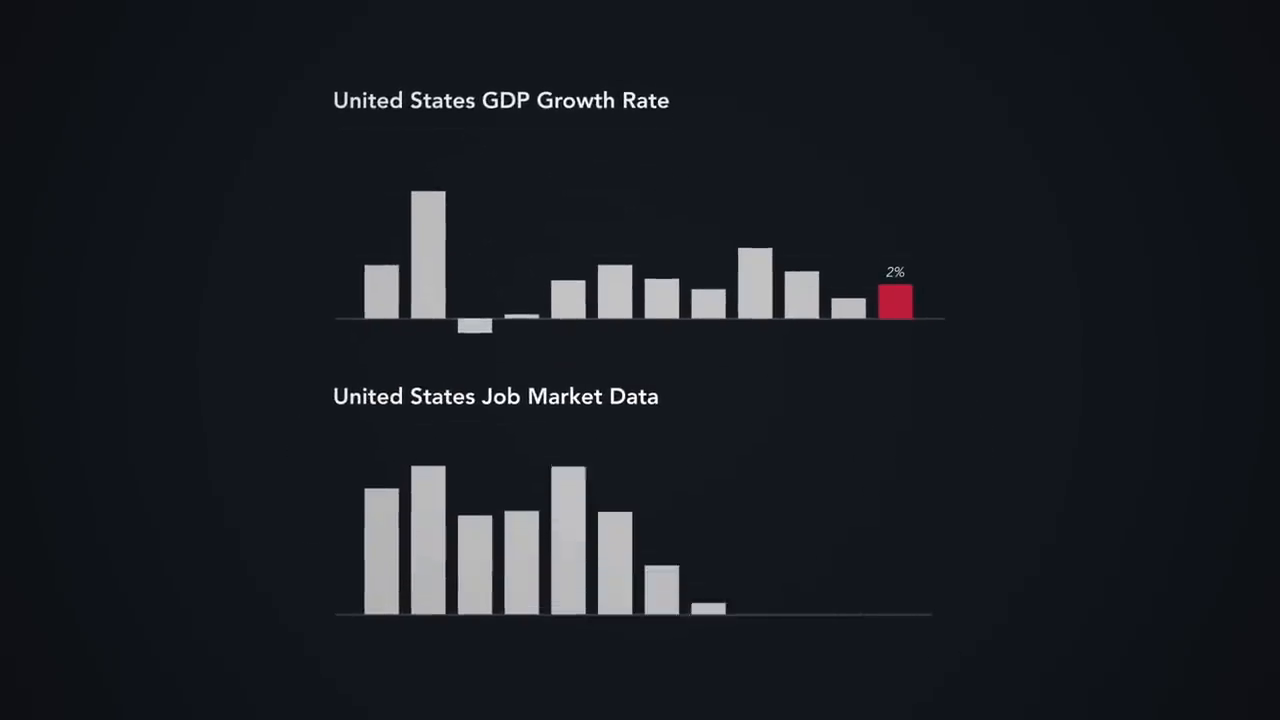
Exploring why today's steepened yield curve has not yet resulted in a recession.
Despite the yield curve steepening today, the U.S. economy remains robust, presenting an unusual scenario. There are three key macroeconomic indicators to consider:
- Gross Domestic Product (GDP): The U.S. GDP is growing at a steady rate of 2%, according to government data.
- Job Market Strength: Employment statistics indicate a strong labor market, with job opportunities remaining plentiful.
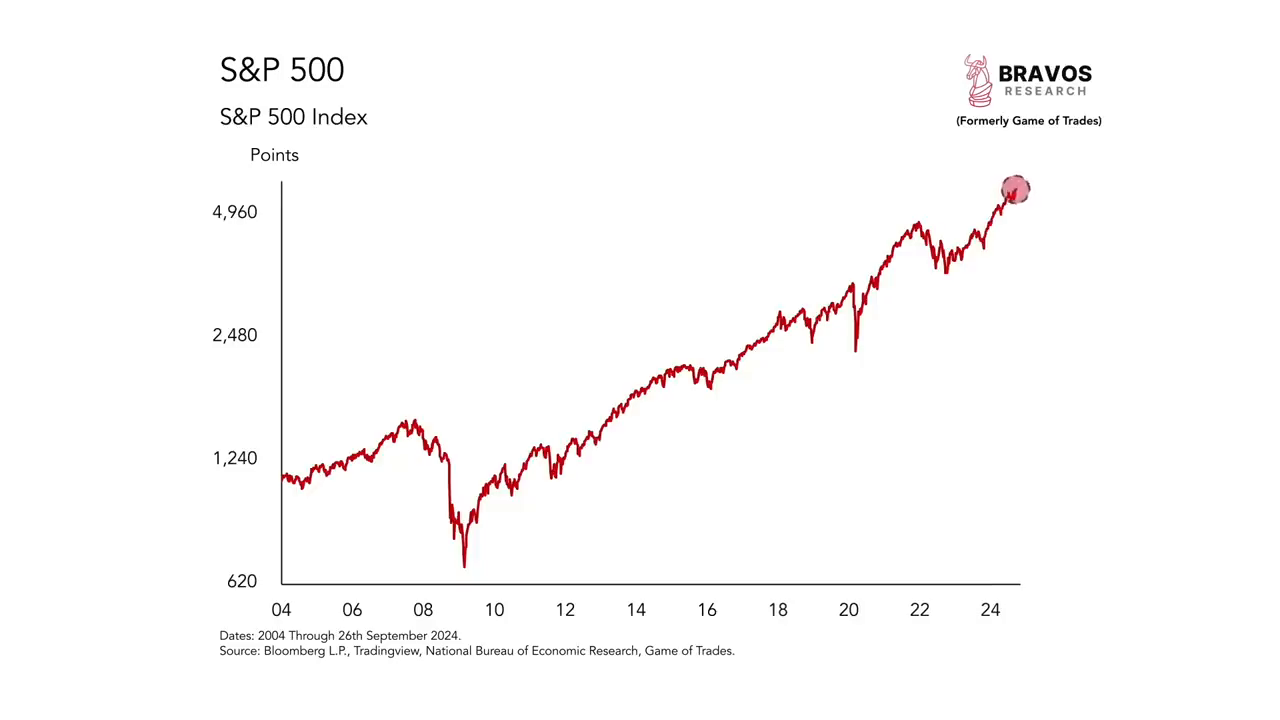
- Stock Market Performance: Much to everyone's surprise, the stock market is performing at or near all-time highs—an anomaly in typical recessionary behavior.
These factors don’t align with what we traditionally observe in a recessionary environment. Could this mean the yield curve is no longer the "flawless" predictor it once was? Let’s explore further.
Is the yield curve still reliable?
The yield curve as a recession indicator has an impeccable track record, with its predictive nature discovered by economist Campbell Harvey in the 1980s. But given today’s economic conditions, should we begin questioning its validity?
A closer examination reveals that recessions don’t begin as soon as the yield curve steepens. The last four recessions demonstrate varying timelines between the steepened yield curve and the recession's official commencement:
- 1989 & 2020: Recessions began when the yield curve was merely at 0.1%.
- 2001: The recession started when the curve was at 0.5%.
- 2007: The yield curve reached a full 1% before the recession’s onset.
Today's yield curve is within the "hot zone"—the range where recessions have historically commenced. If we compare this uncertainty to 2007, where the curve steepened to 1% before the actual downturn, we might not see recessionary signals until January 2025. If the yield curve continues to deviate without a recession, only then will its reputation as a recession indicator be meaningfully challenged.
An alternative analysis: the job market's reflection
The trends in jobless claims and their potential as recession indicators.
A complementary approach to examining the yield curve is by looking at initial jobless claims, which track weekly claims for unemployment benefits. Historically, jobless claim trends mirror the yield curve. For example, when the yield curve steepens heading into a recession, jobless claims typically rise in tandem. Surprisingly, as the yield curve steepened this time around, jobless claims have remained consistently low—indicating strong employment.
This divergence prompts two plausible scenarios:
Scenario A: No recession soon
- If jobless claims don’t rise, the yield curve may re-invert, effectively delaying the timeline for a recession. Comparable instances occurred briefly in 1999 and 2006, where steepening occurred but jobless claims remained low. In both cases, recessions ultimately followed years later.
Scenario B: Recession on the horizon
- Should jobless claims increase in the coming months, they might catch up to the yield curve's warning. This mirrors the conditions in 2007 when the labor market showed signs of strength even as the yield curve steepened, only for jobless claims to rise later as the recession took hold.
The role of government spending
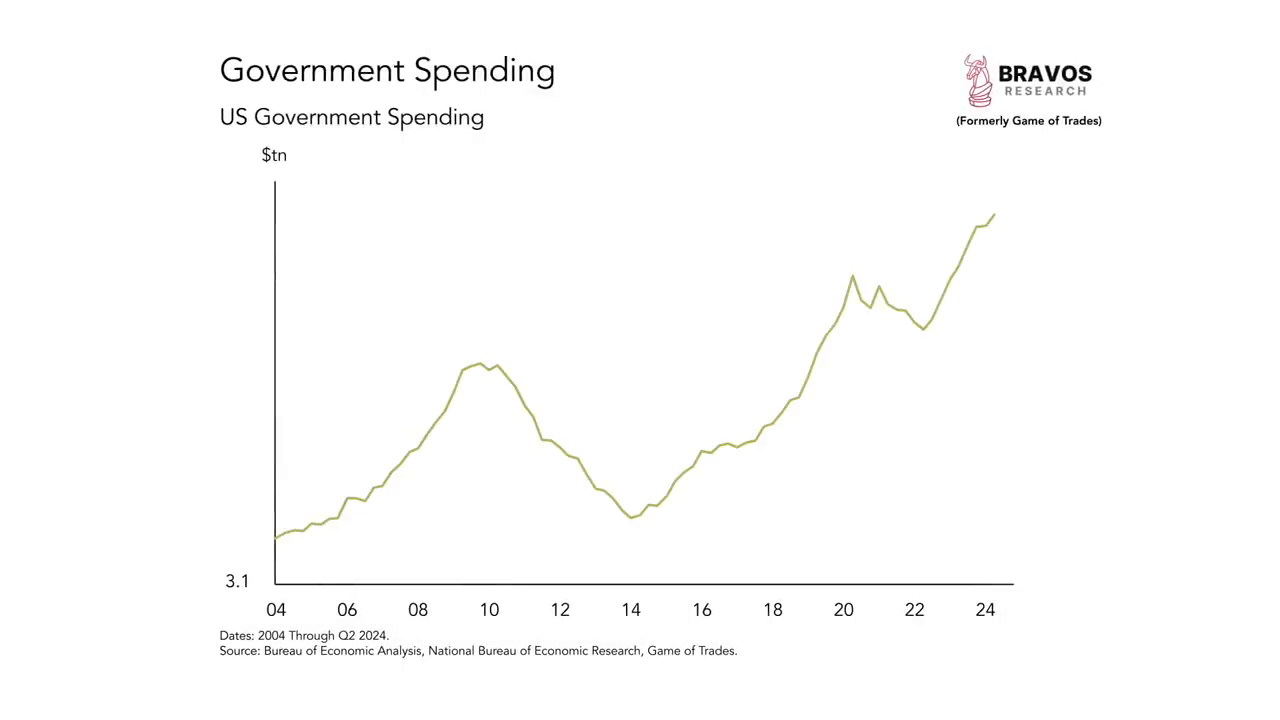
Considering the impact of government spending on delaying an economic recession.
Some experts argue that extraordinary levels of government spending may be cushioning the economy from slipping into a recession. While current spending levels are indeed historically high, one cannot overlook the fact that the U.S. government was actively spending before the 2008 recession as well. Despite their efforts, the spending failed to stave off the most significant economic downturn since the Great Depression.
The implication here is simple: although government spending may delay a recession, it is unlikely to prevent one entirely.
Market implications and strategizing for the future
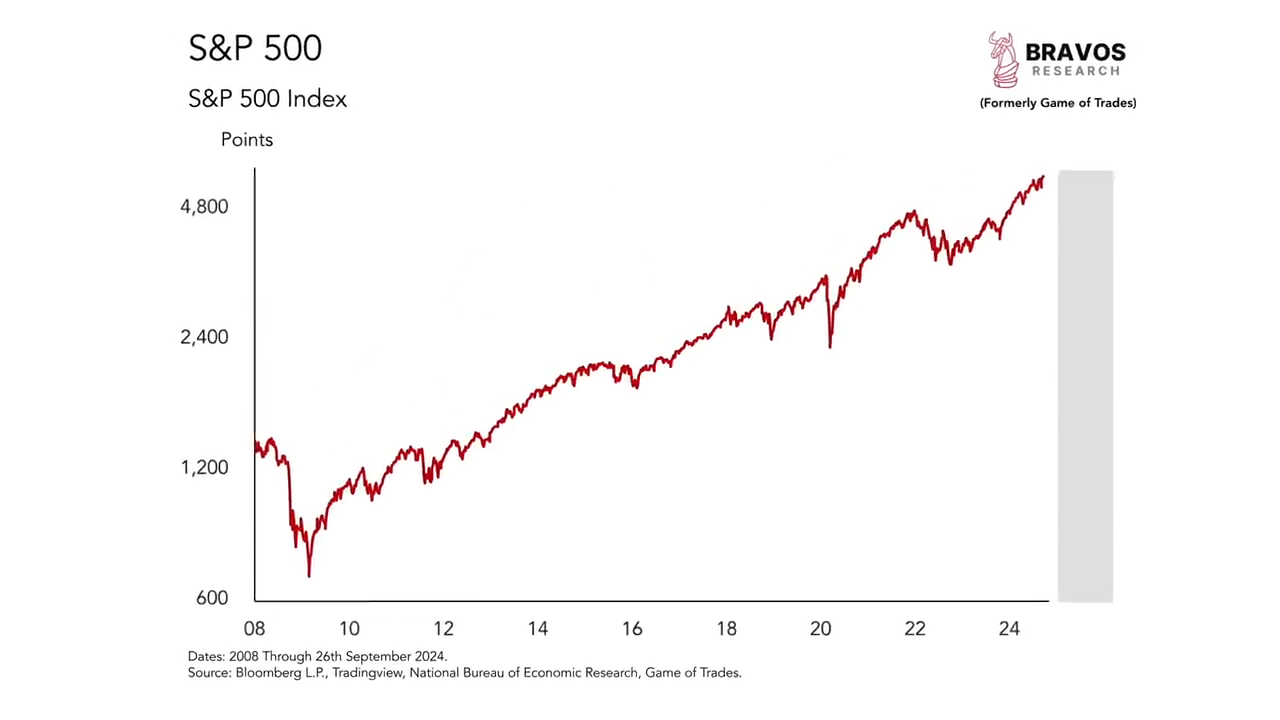
Evaluating how stock markets respond before recessions.
The stock market often reacts in tandem with economic fears, and it’s common to see declines ahead of recessions. This pattern occurred in the early 2000s, shortly before the 2007 crisis, and even in past events like the 1974 and 1980 recessions.
However, there is also precedent for the stock market peaking shortly before a downturn, such as in July 1990 and September 1929. These examples caution investors about becoming overly bearish too early.
Conclusion: what lies ahead?
The steepening of the yield curve remains an essential signal for investors and economists alike. While historically accurate, recent data challenges its absolute reliability. The current divergence from traditional indicators like jobless claims, coupled with high levels of government spending, suggests that predicting the timing of a recession is more complex than ever before.
Whether the next few months bring jobless claims in line with the steepening yield curve or we find ourselves in uncharted territory, one thing remains clear: staying flexible with equity strategies is critical. Investors must remain vigilant about both historical patterns and emerging trends, ensuring they’re prepared for market shifts that might redefine recession forecasting altogether.
